2026 (Q2)
Short Management Discussion and Analysis
Key movements in Q2/26
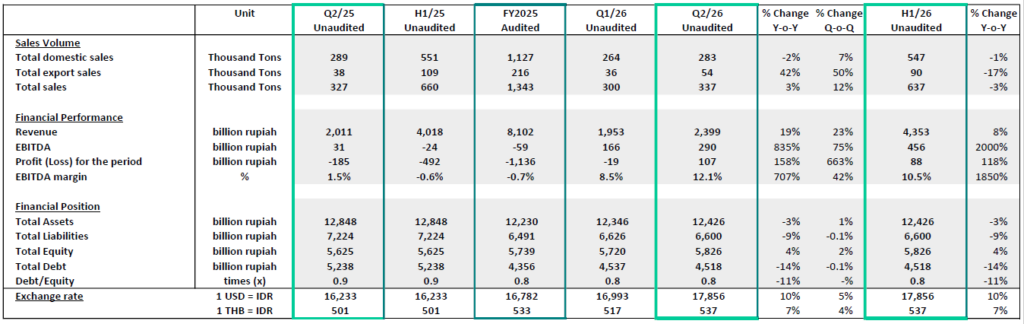
Y-on-Y highlights, Q2-2026 against Q2-2025:
- Sales volume increased by 3%, driven by higher export sales. Export sales volume accounted for 16%, up from 12% of total sales in the prior year.
- Sales revenue increased by 19%, primarily driven by increase in sales volume and higher average selling prices as the market strengthened.
- Cost of Goods Sold increased by 6%, mainly due to inventory drawdown (higher sales vs. lower production), while underlying manufacturing costs per unit remained largely stable.
- The value and margin of EBITDA increased, primarily driven by higher sales revenue.
- Profit for the period increased, supported by higher EBITDA and EBITDA margin.
- Total liabilities and debt decreased by 9% and 14%, respectively, primarily because of debt repayments.
- Debt/Equity improved by 11%, driven by a combination of equity growth and debt reduction.
Q-on-Q highlights, Q2-2026 against Q1-2026:
- Sales volume increased by 12%, driven by higher domestic and export sales. Export sales volume accounted for 16%, up from 12% of total sales in the prior quarter.
- Sales revenue increased by 23%, primarily driven by increase in sales volume and higher average selling prices as the market strengthened.
- Cost of Goods Sold increased by 17%, mainly due to inventory movement normalization.
- The value and margin of EBITDA increased, primarily driven by higher sales revenue.
- Profit for the period increased, supported by higher EBITDA and EBITDA margin.
- Total liabilities and debt both decreased by -0.1%, due to debt repayments.
- Debt/Equity remained stable compared to the prior quarter.
Y-on-Y highlights, H1-2026 against H1-2025:
- Sales volume has decreased by 3%, driven by lower export sales. Domestic sales volume accounted for 86%, up from the prior year’s 83% of total sales.
- Sales revenue has increased by 8%, primarily driven by higher average selling prices amid a stronger market.
- Cost of Goods Sold has decreased by 4%, from lower production volumes.
- The value and margin of EBITDA increased, primarily driven by higher sales revenue.
- Profit for the period increased, supported by higher EBITDA and EBITDA margin.
- Total liabilities and debt decreased by 9% and 14%, respectively, primarily because of debt repayments.
- Debt/Equity improved by 11%, driven by a combination of equity growth and debt reduction.
Notes:
– On 30 June 2026, the Total Debt of IDR 4,518 billion consisted of around USD 18 million and IDR 4,196 billion.
– Average cost of debt (pre-tax, trailing-twelve months) has slightly decreased in Q2-2026 from the previous quarter, from 6.4% (Q1/26) to 6.2% (Q2/26), reflecting proactive management and optimization of the debt structure.
2026
| Title |
|---|
2025
| Title |
|---|
2024
| Title | |||
|---|---|---|---|
|
Fajar Quarterly Highlight Q1 2024 1 104 downloads |
2024 | March 31, 2024 | Download |
|
Fajar Quarterly Highlight Q2 2024 1 70 downloads |
2024 | June 30, 2024 | Download |
|
Fajar Quarterly Highlight Q3 2024 1 56 downloads |
2024 | September 30, 2024 | Download |
|
Fajar Quarterly Highlight Q4 2024 1 37 downloads |
2024 | December 31, 2024 | Download |
2023
| Title |
|---|
2022
| Title |
|---|
2021
| Title |
|---|
2020
| Title |
|---|